
News
You are invited to use the opportunity to test Elsevier's scientific production analytical tool SciVal

2022-10-21
You are invited to use the opportunity to test Elsevier's scientific production analytical tool SciVal
We are pleased to announce that Elsevier has granted a free temporary access to SciVal analytical tool till November 15, 2022.
The tool is accessible from the Scopus database website interface:
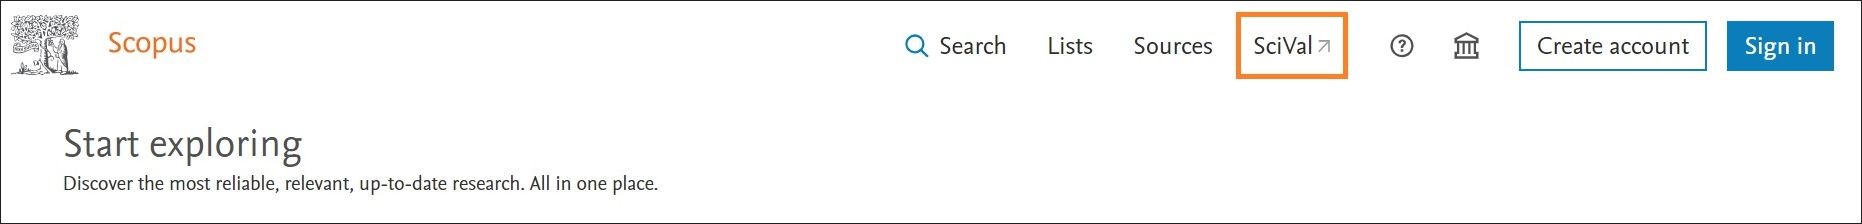
Or via internet address: https://www.scival.com/
SciVal – is an analytical tool designated for a rapid, convenient and comprehensive assessment and analysis of scientific output. The tool utilizes data from Scopus database, covering over 55 M publications (from 1996), published in over 24,000 serial sources by over 5,000 publishers. These data allows to analyze the scientific output of over 20,000 scientific institutions and their researchers from over 230 countries.
The tool consists of separate analysis modules, allowing to assess and visualize the coverage, impact, and prioritized areas of scientific research, evaluate the progress by comparing the data within various contexts and levels; discover collaboration and even financing opportunities, identify the most relevant and the most perspective research areas and their trends, and to generate various reports.
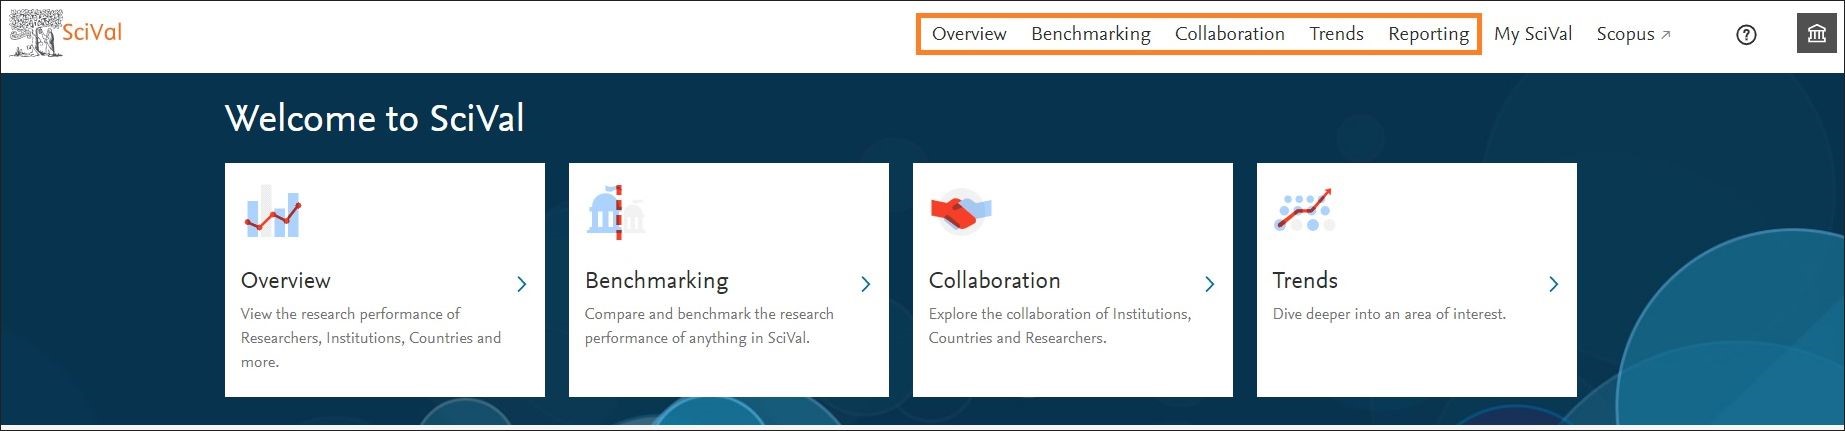
Overview module
This module allows to evaluate scientific output of a selected institution (or their group, e.g. entire alliance), of a researcher (or research group), of a country or a region, or published in a particular Scopus indexed source by various aspects and in accordance with the selected science classification scheme. The overview provides the numbers of publications and their views, citation data, the most prominent research topics, the most productive authors, awarded grants and their financing information, technological impact of publications (patent citations), and even societal impact (media mentions (in English media). Publications can be additionally assessed by their represented scientific categories, their alignment with the Sustainable Development Goals (SDGs), Scopus sources and their represented quartiles (Q) based on the selected metric (CiteScore, SJR, or SNIP). Moreover, the main indicators of scientific output used in the global university rankings (QS, ARWU, THE) are also provided with the ability of further analysis (in case of THE rankings), which are highly relevant in assessing university’s progress and in formulating future strategies. All aforementioned aspects can also be applied in evaluating individual research areas, topics or their clusters, as well as any other publication sets.
Benchmarking module
This module is especially useful in determining research priorities and formulating strategies since it allows to assess the progress and strongest points of analyzed entities as well as trach their changes in time within the contexts of all levels (from individual researchers to countries and regions). It should be noted that entities of different types and levels can be analyzed together at the same time (e.g., you can benchmark individual researchers or publication sets against whole institutions, research areas, countries, regions, and so on).
Collaboration module
This module allows to assess current and potential collaboration opportunities based on publication and their citation data visually (in the map) or in the table format within global, country or region, or specific sector context.
Trends module
This module is dedicated to assess general indicators and tendencies in particular research areas and to identify countries or regions, institutions and researchers who have excelled in a specific field. The organizations that funded the most research in the analyzed research area, the sources indexed by Scopus, where the research from that field was published most often, and the key phrases or words used most often in the analyzed research area are also distinguished in this module.
Report module
This module allows to rapidly generate data reports of analyzed entities by using report templates provided by SciVal or by their partners, or by creating customized reports. In any case, separate parts of reports can be easily edited. Reports can also be compiled from or enriched with the data generated within other analysis modules.
Within all modules the performed analysis can be specified by changing the time-frame and/or applying additional filters. It is also possible to choose the metrics and indicators to be used in the analysis. It should be noted, that all modules are interrelated. Therefore, while transferring from one module to another, not only the analyzed entity (if applicable according to the analysis type), but also all additional previously applied filters remains fixed within the modules.
All data, their visualizations (graphs), publication sets, and reports generated in SciVal can be saved, exported, and shared with other SciVal users (in this case, the registration to the SciVal account is required, but if you have a personal Scopus account, you do not need to create a new account – you can sing-in to SciVal with the Scopus account’s credentials).
SciVal can also be used to analyze external data. For instance, you can import and analyze the results of search performed in Scopus database.
Additional information about the SciVal tool and its usage
The very home page of the tool provides a wealth of information and additional links about the SciVal tool and how to use it:
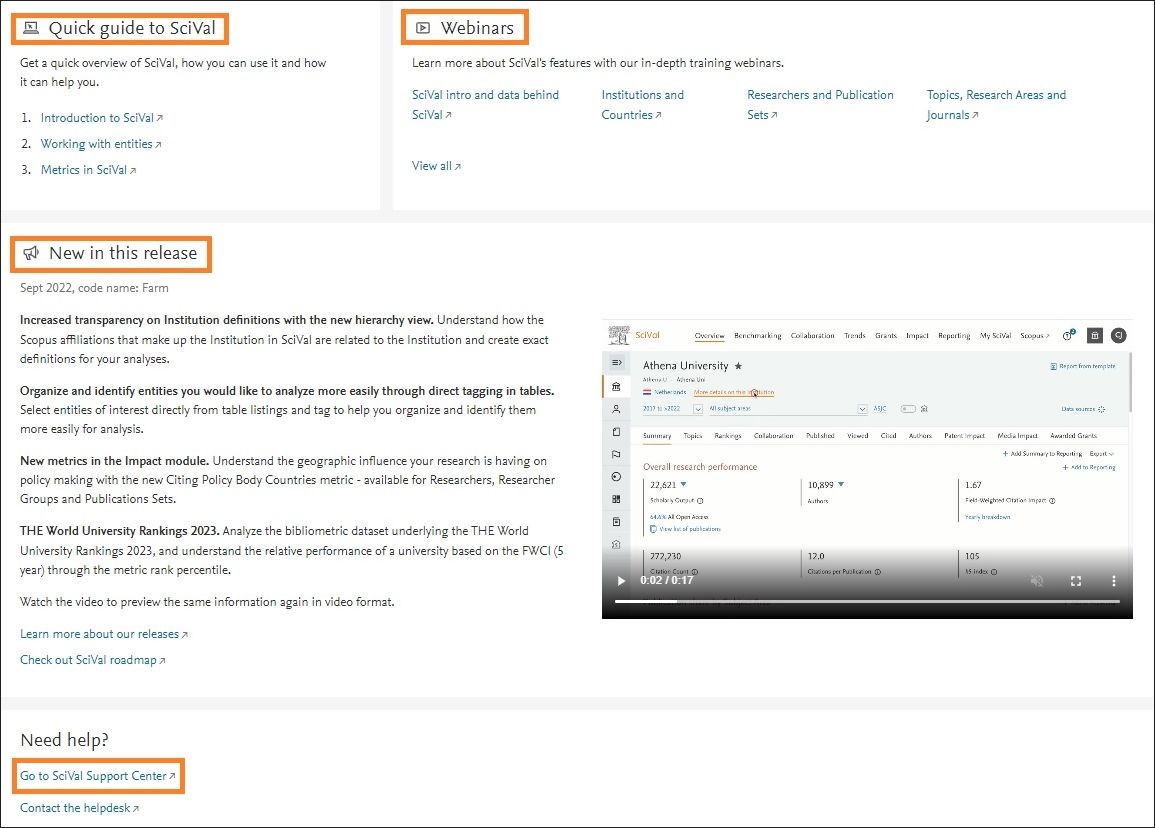
The tool is also described on the Elsevier website.
More detailed and in depth information about the SciVal modules and their application, along with the practical examples, is provided in the recorded virtual seminars:
Scopus, SciVal & Rankings: What is good to know? (Passcode: ILP1Y+@7)
SciVal Camp 2022 Day 1 (Passcode: 9PVP0J*$)
SciVal Camp 2022 Day 2 (Passcode: Q@zwiDG1)
SciVal Camp 2022 Day 3 (Passcode: q8w!^Kit)
Additionally, we are inviting you to join the upcoming virtual Elsevier seminar “Scopus & SciVal towards reporting data” to learn more about how you can use Scopus and SciVal in your work, which will be held on October 25th.
Register here >>>
The tool is accessible from the Scopus database website interface:
Or via internet address: https://www.scival.com/
SciVal – is an analytical tool designated for a rapid, convenient and comprehensive assessment and analysis of scientific output. The tool utilizes data from Scopus database, covering over 55 M publications (from 1996), published in over 24,000 serial sources by over 5,000 publishers. These data allows to analyze the scientific output of over 20,000 scientific institutions and their researchers from over 230 countries.
The tool consists of separate analysis modules, allowing to assess and visualize the coverage, impact, and prioritized areas of scientific research, evaluate the progress by comparing the data within various contexts and levels; discover collaboration and even financing opportunities, identify the most relevant and the most perspective research areas and their trends, and to generate various reports.
Overview module
This module allows to evaluate scientific output of a selected institution (or their group, e.g. entire alliance), of a researcher (or research group), of a country or a region, or published in a particular Scopus indexed source by various aspects and in accordance with the selected science classification scheme. The overview provides the numbers of publications and their views, citation data, the most prominent research topics, the most productive authors, awarded grants and their financing information, technological impact of publications (patent citations), and even societal impact (media mentions (in English media). Publications can be additionally assessed by their represented scientific categories, their alignment with the Sustainable Development Goals (SDGs), Scopus sources and their represented quartiles (Q) based on the selected metric (CiteScore, SJR, or SNIP). Moreover, the main indicators of scientific output used in the global university rankings (QS, ARWU, THE) are also provided with the ability of further analysis (in case of THE rankings), which are highly relevant in assessing university’s progress and in formulating future strategies. All aforementioned aspects can also be applied in evaluating individual research areas, topics or their clusters, as well as any other publication sets.
Benchmarking module
This module is especially useful in determining research priorities and formulating strategies since it allows to assess the progress and strongest points of analyzed entities as well as trach their changes in time within the contexts of all levels (from individual researchers to countries and regions). It should be noted that entities of different types and levels can be analyzed together at the same time (e.g., you can benchmark individual researchers or publication sets against whole institutions, research areas, countries, regions, and so on).
Collaboration module
This module allows to assess current and potential collaboration opportunities based on publication and their citation data visually (in the map) or in the table format within global, country or region, or specific sector context.
Trends module
This module is dedicated to assess general indicators and tendencies in particular research areas and to identify countries or regions, institutions and researchers who have excelled in a specific field. The organizations that funded the most research in the analyzed research area, the sources indexed by Scopus, where the research from that field was published most often, and the key phrases or words used most often in the analyzed research area are also distinguished in this module.
Report module
This module allows to rapidly generate data reports of analyzed entities by using report templates provided by SciVal or by their partners, or by creating customized reports. In any case, separate parts of reports can be easily edited. Reports can also be compiled from or enriched with the data generated within other analysis modules.
Within all modules the performed analysis can be specified by changing the time-frame and/or applying additional filters. It is also possible to choose the metrics and indicators to be used in the analysis. It should be noted, that all modules are interrelated. Therefore, while transferring from one module to another, not only the analyzed entity (if applicable according to the analysis type), but also all additional previously applied filters remains fixed within the modules.
All data, their visualizations (graphs), publication sets, and reports generated in SciVal can be saved, exported, and shared with other SciVal users (in this case, the registration to the SciVal account is required, but if you have a personal Scopus account, you do not need to create a new account – you can sing-in to SciVal with the Scopus account’s credentials).
SciVal can also be used to analyze external data. For instance, you can import and analyze the results of search performed in Scopus database.
Additional information about the SciVal tool and its usage
The very home page of the tool provides a wealth of information and additional links about the SciVal tool and how to use it:
The tool is also described on the Elsevier website.
More detailed and in depth information about the SciVal modules and their application, along with the practical examples, is provided in the recorded virtual seminars:
Scopus, SciVal & Rankings: What is good to know? (Passcode: ILP1Y+@7)
SciVal Camp 2022 Day 1 (Passcode: 9PVP0J*$)
SciVal Camp 2022 Day 2 (Passcode: Q@zwiDG1)
SciVal Camp 2022 Day 3 (Passcode: q8w!^Kit)
Additionally, we are inviting you to join the upcoming virtual Elsevier seminar “Scopus & SciVal towards reporting data” to learn more about how you can use Scopus and SciVal in your work, which will be held on October 25th.
Register here >>>
