


About Citizen Science community
Citizen science is defined as the participation of non-professional scientists in the scientific process. However, it is important to note that different organisations use different reference points and criteria to define citizen science and focus on different contexts (Hacklay et al., 2021).
Citizen Science projects
Citizen science projects can cover a wide range of scientific fields. The most common citizen science projects are in the fields of biology, astronomy, medicine, computer science, statistics, psychology and engineering science (National Geographic, 2021; Pérez and Costa, 2018). Projects range in scope from large international projects involving professional scientists and research institutions to small groups with members sharing common interests (Grey et al. 2016). The involvement of non-professionals in such projects can also take many forms, ranging from more effective communication of scientific advances to contributing to the scientific process itself, e.g. by defining research problems, developing research methodologies, collecting and analysing data (European Commission, 2020; ECSA, 2015). Voluntary public participation is a prerequisite for citizen science projects (Grey et al. 2016).
Much citizen science project work can be carried out close to home, and sometimes even in people's backyards, living rooms and kitchens, following established scientific protocols and under the guidance of professional scientists (National Geographic, 2021). Citizen scientists gain new scientific knowledge through projects and feel empowered to contribute to the collection of scientific evidence and influence policy decisions (ECSA, 2015). It is worth noting that citizen scientists come from all walks of life, including pensioners, educators and students (Scistarter, 2021).
Citizen science projects are typically designed to collect large datasets that would be difficult to obtain through other methods due to lack of time, geographical or human resources. For example, several citizen science projects have been set up to study coral reefs. These projects have enabled the collection of large amounts of data with the help of thousands of tourists who like to take pictures underwater (Peterson et al., 2020). Citizen science projects are also useful for processing large volumes of data that artificial intelligence cannot process. For example, identifying protein or galaxy structures in mass data.
The further development of citizen science is driven by established associations and networks that promote and coordinate citizen science projects, influence policy decisions and organise conferences and events (e.g. ECSA - European Citizen Science Association, Lithuanian Citizen Science Association - www.pilieciumokslas.lt). The ongoing development of crowdfunding platforms, machine learning and artificial intelligence technologies, which allow more volunteers to contribute to a wider range of research projects, are also playing a prominent role (Grey et al., 2016).
Citizen science can (i) foster efficient and transparent science funding; (ii) lead to broader engagement, governance and accountability of research; (iii) bring European policy-making closer to the people by enabling decisions to be based on science and data; and (iv) contribute to economic growth through open innovation (European Commission, 2020). In this context, policy makers across Europe are gradually looking at citizen science as an opportunity to increase public engagement and democratise science.
Citizen Science in Lithuania
Citizen science is seen as a key driver to facilitate and sustainably promote a more inclusive society by innovating to address key societal challenges (Robinson et al., 2018). Engaging a specific interest group is a significant challenge, given that the motivation is not necessarily shared by the participants. Moreover, these groups include a significant number of people with poor digital skills or even limited relevant resources to access the tools and materials provided. In 2017, 43% of the EU population had an insufficient level of digital skills, 17% had no digital skills at all, either because they did not use the internet or hardly used it at all, and only around 31% had a low level of education or no education at all (DESI, 2019). Moreover, very often, the tools used to engage the public do not include these groups, thus negating the expected impact and reinforcing social barriers and exclusion. Lithuania's citizens and communities remain cautious and hesitant as technology evolves and pushes rapid societal transformations in everyday habits and norms (Skaržauskienė and Mačiulienė, 2020). However, the country has all the prerequisites to become a 'smart' society: a relatively high level of information technology infrastructure, high consumer accessibility (quality internet is available not only in cities but also in 98.7% of rural areas), and a small population (2.7 million people). The growth in internet accessibility and opportunities has created the conditions for the explosive growth of online communities in Lithuania, but their potential is not being fully exploited due to a lack of citizen engagement. In Lithuania, as in other post-Soviet countries, there is a deep-rooted perception that citizens cannot influence social life or government decisions. Perfect technological preconditions do not encourage the growth of collective intelligence, because people do not cooperate, express their opinions but do not structure them, nor do they take on the responsibility to implement decisions (Skaržauskienė, 2015).
CS can effectively serve policymaking initiatives and processes by providing evidence and useful insights to ensure compliance with legislation in a transparent and participatory manner, and it can also serve the public by enabling them to address specific societal issues that directly affect citizens and to influence decision-making on these issues at national and EU level (Strasser et al., 2018). A number of policies have been discussed at national level, although policy makers and stakeholders (including public authorities and other national and EU initiatives) still lack the right level of preparedness to understand the innovations brought by citizen inclusion. Policy makers often have different interests, motives, expectations and perceptions of the achievements and outcomes of citizen science activities and efforts (Butkeviciene, 2020).
From the perspective of Lithuanian industry and business, CS could be seen as a potential competitor to established large-scale platforms that profit from human data. An obstacle to overcome is the identification of the right stakeholders in different sectors that can benefit from the planned CS results. Another major challenge to be overcome is strengthening communication about the value and opportunities of CS.
From an academic perspective, Lithuanian researchers are most concerned about how to facilitate a participatory process to strengthen the role of citizens as key actors in the research "process". Around these challenges, three dimensions emerge as critical barriers that act as key to effective collaboration: data, awareness, synergy (Mitchelll et al., 2017). Quality assurance, the regulatory framework, comprehensive schemes for citizen input to the EC Open Access policy, and appropriate approaches to facilitate visibility of scientific outputs and to support re-use and extension of their CS outputs as open science contributions are all high on the agenda and at risk.
Another problem is that CS has mainly been carried out in the field of natural sciences (Tauginiene et al., 2020). Activities and projects guided by social sciences and humanities (SSH) themes and approaches are less visible in CS practice, even though they may be driven by some genuine and challenging issues (Heiss and Matthes, 2017).
Results of the Citizen Science Awareness Survey in Lithuania
The survey uses a quota sample of 1.936 responses in total, from the general public in four countries across Europe: Greece, Lithuania, the Netherlands, and finally Spain. These four countries represent the four pilot RPFOs of the INCENTIVE project. It was decided to collect responses from the national population instead of only from the regional population of the pilot ecosystems. The decision was based on the fact that the project’s RPFOs have a nationwide scope in terms of students, visiting personnel and networking channels, and therefore having evidence from the overall national population will help them co-create Citizen Science Hubs that reflect national patterns. Data collection took place from April 2021 to June 2021. Initially, a quota sample of 500 responses was set as target for each country (resulting to 2.000 responses roughly). However, the demographic dynamics and uneven sizes of the selected countries necessitated a different internal division of the sample, so as to achieve representation in terms of actual population sizes. Therefore, following an open deliberation between WR and the pilot partners, it was decided that 350 responses should be collected approximately for the cases of Greece and Lithuania, while 600 responses should be collected approximately for the cases of the Netherlands and Spain.
Apart from the core questionnaire sections (in more detail below), the survey also collected demographic information about the participants, such as educational level, age and occupational status. Another critical element was the classification of responses according to the quadruple helix groups: private sector/industry (e.g., SMEs owners, entrepreneurs, CEOs), public administration (e.g., policy makers, civil servants, elected officials), academia (e.g., professors, researchers) and civil society (e.g., CSOs representatives, NGOs representatives). For participants that were reluctant to choose one the previous categories, the category of “general public”, could be selected. Understanding the perceptions and attitudes towards Citizen Science of the last category is particularly important, since Citizen Science Hubs are expected to pay special attention to ordinary citizens, especially those who are unfamiliar with the concept. A final important point that was collectively agreed by all partners was that the sample should be representative in terms of gender for all countries (see Table 10).

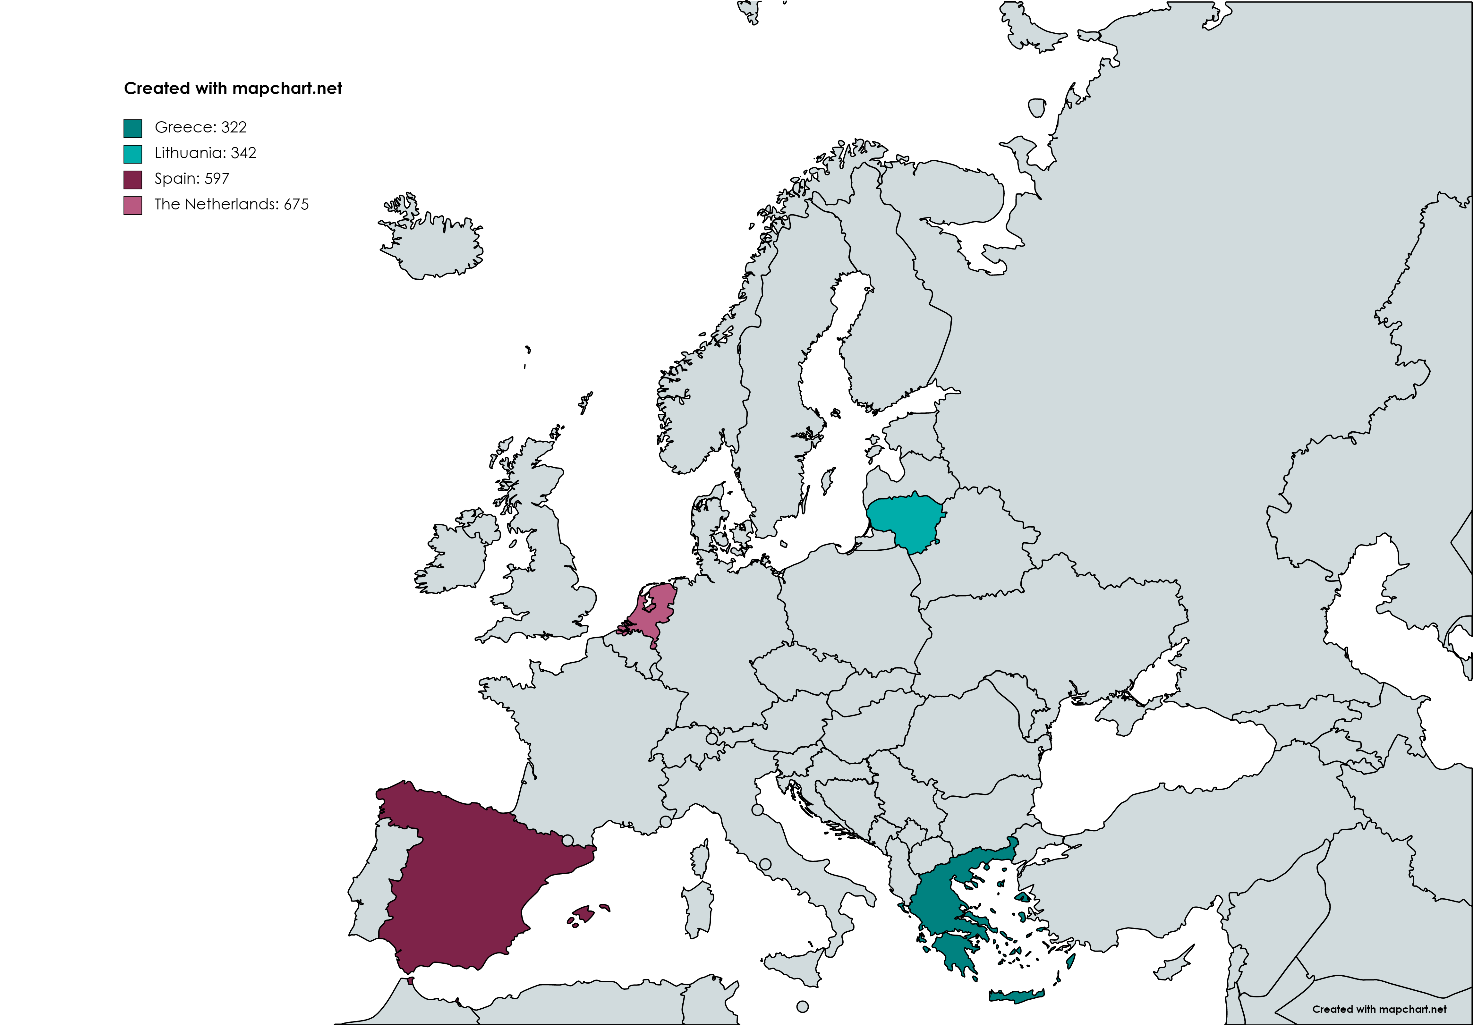
Figure 5. Surveyed countries and distribution of sample.
Source: MapChart.net
White Research was the responsible for drafting the initial questionnaire for the survey. For the creation of the survey, the EC survey platform was used. The questionnaire was then provided to the consortium for further discussion and improvements. After WR has integrated all partners’ feedback, the survey was translated into the national languages by the pilot RPFOs, and then distributed to them by WR through a survey link. As such, pilot RPFOs took over responsibility for collecting the required number of responses and meet the internal quotas. In the cases of Greece and Lithuania, AUTH and VGTU used a variety of dissemination channels respectively to distribute the survey to the general population. These channels included:
Once all pilot RPFOs have met their internal quotas, WR closed the survey and started the analysis of the data.
Based on the results from the qualitative literature review (step 1) and semi-structured interviews (step 2), that have identified the current state-of-the-art in terms of trends, barriers and drivers of Citizen Science in each pilot country, the survey questionnaire was structured so as to get additional insights about these aspects, and quantitatively confirm the findings from the previous analysis. The descriptive characteristics of the sample and the distribution of the collected responses are presented in detail in Section 7.3.1.
Regarding the process of the questionnaire development, WR has incorporated the findings from the literature review and thematic analysis and presented a draft version of the questionnaire to the consortium, for peer-review and discussion. The final version of the survey questionnaire reconciles – to the extent possible – the range of views and opinions from all partners and can be found on Annex D.
The survey questions were clustered in 6 main sections, each of which corresponds to a research question. Each section and its rationale are presented briefly below:
The large-scale survey tried to capture the current state-of-the-art in the four different countries of pilot RPFOs (Greece, Lithuania, the Netherlands, and Spain), by collecting ~2.000 questionnaires in total. Table 7 indicates the final numbers of collected questionnaires.
Table 7. Number of observations by country
In order to better understand the survey results, an initial descriptive analysis of the sample for each country is needed. This provides all the necessary information regarding the type of stakeholders that have participated in our survey, alongside their demographic characteristics (age, sex, education level and occupational status). In this regard, Tables 8 and 9 present the overall sample structure (per absolute value[1] and percentage, respectively), highlighting that it is gender balanced in all countries. In terms of age structure, the Greek sample is characterised by an increased share of persons between 20-29 years old (40.68%) compared to other regions, followed by a very low share of under 20 years old (8.07%) and 60+ years old group of participants (5.28%). On the other hand, the opposite trend is observed in the Netherlands, where people from 60+ years old group form the majority (37.33%), with the shares of participants from other age groups decreasing in the same manner as the age intervals decrease. In Spain, the vast majority of respondents fall under the age groups 20-29 and 30-39 years old (64.16%), while participation from under 20 years old and 60+ years old group is marginal. Finally, in Lithuania, there is a more even distribution regarding participation from the different age groups, with people belonging to 40-49 years old age group being the majority.
When taking a closer look at the educational structure of the national samples, the distribution between the four pilots shows strong deviations. Although in all cases no education covers less than 5% of the samples, secondary education in the case of the Netherlands covers almost half of the collected sample (42,88%). At the same time, tertiary education shares, including both bachelor’s degree and master’s degree levels of tertiary education, are higher for the cases of Greece (57.63%), Lithuania (76.97%), and Spain (58.49%). It is also noticeable that in Greece, almost 1 out of 4 participants hold a PhD or equivalent (24.22%).
Stakeholder distribution is of equal importance to understand better the national samples. For the case of Lithuania, the distribution of stakeholders is interestingly even, with almost all categories having a share of roughly 20%, except from participants from the general public and civil society (43.28%). On the other hand, both in the cases of the Netherlands and Spain, the majority of respondents come from the general public/civil society (60.00% and 43.05%, respectively). However, the two countries differ regarding the distribution among the other stakeholder groups. In Spain, academic stakeholders come second (25.80%), while in the Netherlands the second highest stakeholder group is industry (21.04%). Finally, in Greece stakeholders from academia form the majority of participants, with a noticeable share of 63.04%.
The last demographic insight that we used for describing our samples refers to the occupational status of our survey participants. In this case, the majority in all cases – with the exception of Greece – refers to employed persons, which cover almost half or more than half of the national samples: 68.32% in Lithuania, 51.11% in the Netherlands, and 49.16% in Spain. Some particularities that differ between countries include the following: (i) high shares of students in Greece (42.50%); (ii) high levels of unemployed in Spain (17.62%); (iii) high share of retired persons in the Netherlands (24.44%); and finally (iv) very low shares of household activity for Greece, Lithuania, and Spain.
Table 8. Sample distribution by demographics and QH group
Table 9. Representativeness of sample in terms of gender
The sample accomplished representativeness in terms of gender, which was the core requirement, as collectively agreed by all partners. Table 9 shows the gender breakdown both at sample level and national population level for each country. As it can be observed, in all countries the sample ratios correspond roughly to the gender ratio at national population level (with Spain reaching the highest level of representativeness). Furthermore, with the minor exception of the Netherlands, in all countries the golden standard of women exceeding men proportionately, has been respected. The figures for national population have been retrieved by Statista (2021, 26/07, last accessed), and refer to year 2020.
The next of the descriptive analysis is to explore the level of familiarity with the term “Citizen Science”. To ensure that all participants approach the concept in an identical way, a description of the term was provided in the survey questionnaire as follows: “Citizen science refers to the active engagement of the general public in scientific research tasks of several disciplines (from natural sciences to social sciences and humanities) and the collaborative production of new knowledge”. This definition was selected as the most inclusive one, so people from different countries and therefore socio-economic and cultural settings could easily understand the term and provide valid answers. Figure 6 presents the level of familiarity with the term for all countries, in a scale from 1 to 5, with 1 indicating total absence of familiarity, and 5 indicating very high levels of familiarity.
Interestingly enough, results reveal that the lowest levels of familiarity are detected in the Netherlands (57.60%) and Lithuania (57.60%). Spain presents a more balanced distribution of scales of familiarity, even though people who declare that they are “somewhat familiar” form the majority (26.97%). Nevertheless, more than 1 out of 4 participants in Spain state that they are completely unfamiliar with the term. Greece shows some common patterns with Spain. On the one hand, the largest proportion of participants (30.12%) fall under the category “not at all familiar”. On the other hand, people who state that they are “somewhat familiar” form the second highest category, with 23.60%. At the same time, across all countries, Spain and Greece have the highest shares of people who say that they are extremely familiar with the term (7.54% and 8.07%, respectively).
Nevertheless, it must be stressed that the national variations on the awareness of CS can be partly explained by the age groups and educational level of participants. For instance, the higher levels of awareness in Spain and Greece are influenced by the fact that CS is a quite new concept and in those countries the percentage of 20-29 years old is higher with respect to Netherlands and Lithuania. Moreover, in Greece, half of participants hold either a Master’s degree or PhD, and there may be a positive correlation between educational level and level of CS awareness. At the same time, more than 4 out of 10 participants in the Netherlands hold only a high school diploma – a fact that may affect how knowledgeable are about Citizen Science. Background variables must be taken into account when unpacking the reasons of awareness levels.
Apart from examining the level of familiarity with Citizen Science, the degree of familiarity with the term “Responsible Research and Innovation” was investigated as well. As in the case of Citizen Science, a definition was provided to participants in the questionnaire: “Responsible Research and Innovation is an approach that anticipates and assesses potential implications and societal expectations with regard to research and innovation, with the aim to foster the design of inclusive and sustainable research and innovation”. This definition was chosen because it is the official definition by the European Commission (2021, 07/07, last accessed). Figure 7 presents the different levels of familiarity across all countries.
What is interesting to observe in the figure is the similarities with Figure 6. In other words, once again in the Netherlands and Lithuania, the majority of participants (43.11% and 45.32%, respectively), belong to the category “not at all familiar”. Reversely, Spain and Greece show the lowest levels from all countries regarding the category “not at all familiar” (14.41% and 19.25% respectively), while in the other side of the spectrum, they display high shares of participants who declare that they are “moderately familiar” with the term (25.29% and 23.29%, respectively). It is also worth-mentioning that in all countries, an interval of 20-25% of participants falls under the category “slightly familiar” with the term. Still, a general conclusion that can be drawn from both Figure 6 and Figure 7 is that the terms “Citizen Science” and “Responsible Research and Innovation” are not yet widely diffused in the general public.
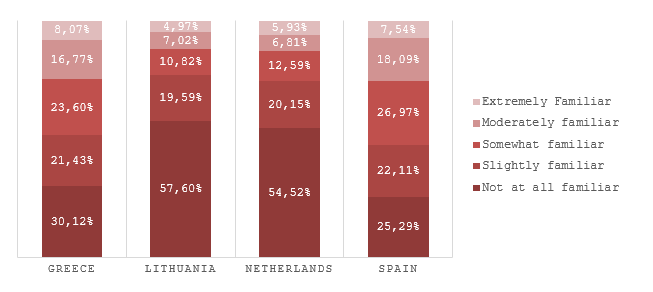
Figure 6. Level of familiarity with the term “Citizen Science”
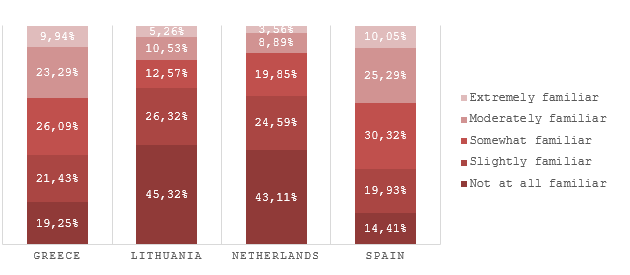
Figure 7. Level of familiarity with the term “Responsible Research and Innovation”
Table 10 deals with the previous experience, if any, with Citizen Science from participants from all pilot countries. In this case, all national countries show exactly the same trends: more than 8 out of 10 respondents have not any previous experience whatsoever with the Citizen Science activities. On the other hand, it should be mentioned that Greece and Lithuania present the highest shares of people who have some previous experience (18.32% and 18.42%, respectively).
Table 10. Previous experience with Citizen Science
The participants who answered “Yes” in the survey questionnaire were re-directed to another question that captures the precise type of previous experience with Citizen Science (Figure 8). Strong differences can be observed between pilot countries. In Lithuania (63.39%) and Spain (38.27%), most people responded that their type of experience is “I have heard the term Citizen Science”. However, in the Netherlands, more than half of the sample (52.17%) stated that they initiative and/or designed themselves a citizen science project – this finding strongly contrasts the findings from the other countries. Finally, in Greece, almost half of participants (45.76%) selected the category “I have participated myself in a citizen science project”.
As general conclusion, it can be inferred that the maturity level of Citizen Science varies across countries, and even if two countries show commonalities, there are still differences with respect to the actual type of experience of the general public with CS activities. This necessitates different governance structures and possibly dissemination and engagement channels for the development of proper Citizen Science Hubs that respond to local social realities.
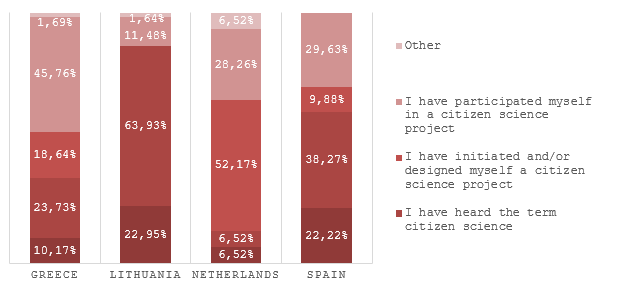
Figure 8. Type of previous experience with Citizen Science
Tables 11-14 present the results for the factors acting as significant benefits, drivers and barriers for citizen science projects related to the different types of stakeholders. To do so, the collected data from all pilot countries based on the type of stakeholder categorization were analysed and therefore, it was possible to get some specific insights about each type separately. Starting from the academics and the researchers that participated in the survey (Table 11), they have highlighted all identified benefits – apart from considering citizen science as a hobby – as significant for their perceptions and involvement in citizen science projects. In terms of drivers, their involvement seems to be motivated by continuous feedback, acknowledgements, inspiring coordination teams and clear guidelines and instructions. Barriers related to their perceptions include concerns whether they belong to a sociodemographic group that is underrepresented in the scientific community, lack of receiving the necessary guidelines and feedback, scepticism about cooperating with other stakeholder groups and fear that the project will not be properly organized and managed.
At this point, it must be stressed that all the identified factors that encourage or hinder participation with respect to CS activities, were statistically analysed and then selected as most important. This is valid for the hindering/enabling factors that were examined both for each stakeholder group and for the local ecosystems of the pilot RPFOs (Section 6.3.3). The factors that were found to be statistically significant (i.e., they have an important impact on the perception or involvement of participants) are marked with a tick sign in all respective tables. More detail on the statistical method that was used and on the initial results that emerged from the statistical analysis can be found on Annex C.
Table 11 Identified benefits, drivers and barriers related to perceptions and the involvement in citizen science projects for academics and researchers
Source: Authors’ elaborations (see Annex C for the detailed statistical results).
When taking a closer look at the responses received from policymakers, it is obvious that fewer factors can be captured referring to these aspects (Table 12). More specifically, benefits related to society and/or natural environment are the only significant factor in the first group, alongside with continuous feedback, inspiring coordinators and clear guidance that can work as significant drivers for policymakers and stakeholders coming from the public sector. Moreover, barriers related to their involvement in citizen science projects include lack of receiving the necessary guidelines and feedback.
Table 12. Identified benefits, drivers and barriers related to perceptions and the involvement in citizen science projects for policy-makers
Source: Authors’ elaborations (see Annex C for the detailed statistical results).
Table 13 presents the findings in relation to participants from the business and the private sector. Again, almost all factors included in the benefits’ list can significantly improve perceptions and involvement of this group in citizen science projects. Drivers in this case include – once more – continuous feedback and updates about the progress of the project, together with good organization and management. At the same time, barriers referring to perceptions highlight the importance of the lack of the technological equipment that might be required, receiving the necessary guidelines and feedback, the feeling of belonging to a sociodemographic group that is underrepresented in the scientific community, as well as concerns about the ability to effectively cooperate with other stakeholder groups. When it comes to actual involvement in citizen science project, the identified barriers include low participation rates and lack of time to participate in such activities from persons in the private sector.
Table 13. Identified benefits, drivers and barriers related to perceptions and the involvement in citizen science projects for business and private sector
Source: Authors’ elaborations (see Annex C for the detailed statistical results).
The final stakeholder group under investigation refers to citizens and the civil society. Table 14 shows that all identified benefits seem to motivate general public towards participating and having an increased perception of citizen science initiatives. In terms of drivers, even though being acknowledged for your contribution and provided with specific guidelines and instructions for the tasks can boost positive perceptions, only receiving continuous feedback and updates about the progress of the project seems to effectively improve participation in citizen science projects by general public. At the same time, it is interesting to notice that there are more barriers that affect both perceptions and involvement when compared to the other stakeholder groups. Common barriers between these two attitudes include: lack of the technological equipment, fear that the contribution will be exploited by scientists/policy makers, fear of leading to wrong or harmful scientific or policy decisions and scepticism about cooperating with other stakeholder groups. Barriers that are solely related to overall perception about citizen science refer to the lack of the necessary skills and knowledge to be involved in such activities, the feeling of belong to a sociodemographic group that is underrepresented in the scientific community, the lack of receiving the necessary guidelines and feedback and fear that the project will not be properly organized and managed. Finally, additional barriers that significantly affect citizens’ involvement in these initiatives include low participation rates, lack of time and fear of not finding an interesting research topic.
Table 14. Identified benefits, drivers and barriers related to perceptions and the involvement in citizen science projects for civil society and general public
Source: Authors’ elaborations (see Annex C for the detailed statistical results).
The next section presents a more thorough descriptive analysis on the trends and patterns in each of the four pilot countries, with the aim to provide a more detailed picture of attitudes, perceptions and propensities at national level.
Apart from the core questionnaire sections (in more detail below), the survey also collected demographic information about the participants, such as educational level, age and occupational status. Another critical element was the classification of responses according to the quadruple helix groups: private sector/industry (e.g., SMEs owners, entrepreneurs, CEOs), public administration (e.g., policy makers, civil servants, elected officials), academia (e.g., professors, researchers) and civil society (e.g., CSOs representatives, NGOs representatives). For participants that were reluctant to choose one the previous categories, the category of “general public”, could be selected. Understanding the perceptions and attitudes towards Citizen Science of the last category is particularly important, since Citizen Science Hubs are expected to pay special attention to ordinary citizens, especially those who are unfamiliar with the concept. A final important point that was collectively agreed by all partners was that the sample should be representative in terms of gender for all countries (see Table 10).
Figure 5. Surveyed countries and distribution of sample.
Source: MapChart.net
White Research was the responsible for drafting the initial questionnaire for the survey. For the creation of the survey, the EC survey platform was used. The questionnaire was then provided to the consortium for further discussion and improvements. After WR has integrated all partners’ feedback, the survey was translated into the national languages by the pilot RPFOs, and then distributed to them by WR through a survey link. As such, pilot RPFOs took over responsibility for collecting the required number of responses and meet the internal quotas. In the cases of Greece and Lithuania, AUTH and VGTU used a variety of dissemination channels respectively to distribute the survey to the general population. These channels included:
- The internal community of the pilot universities (e.g., staff, researchers, students).
- The network of supporting partners that have provided with letters of support to the INCENTIVE project. This network included various stakeholders and organizations.
- Local associations and networks where representatives from the pilot universities’ team are active members.
- Stakeholders from the local media who shared the survey in their social media accounts.
Once all pilot RPFOs have met their internal quotas, WR closed the survey and started the analysis of the data.
Based on the results from the qualitative literature review (step 1) and semi-structured interviews (step 2), that have identified the current state-of-the-art in terms of trends, barriers and drivers of Citizen Science in each pilot country, the survey questionnaire was structured so as to get additional insights about these aspects, and quantitatively confirm the findings from the previous analysis. The descriptive characteristics of the sample and the distribution of the collected responses are presented in detail in Section 7.3.1.
Regarding the process of the questionnaire development, WR has incorporated the findings from the literature review and thematic analysis and presented a draft version of the questionnaire to the consortium, for peer-review and discussion. The final version of the survey questionnaire reconciles – to the extent possible – the range of views and opinions from all partners and can be found on Annex D.
The survey questions were clustered in 6 main sections, each of which corresponds to a research question. Each section and its rationale are presented briefly below:
- Section 1 – Introduction to the topic: In this section, stakeholders’ views were captured regarding their level of familiarity with concepts such as Citizen Science and Responsible Research and Innovation, as well as their type of previous experience with Citizen Science, if any. The second question aims at identifying insights about general public perceptions regarding future trajectories of the regions.
- Section 2 – Perceptions towards Citizen Science: In this section, stakeholders, opinion was asked about Citizen Science in general, such as what are the most significant benefits of Citizen Science, what should be the role of citizens in CS activities, and how the envisioned pilot CS Hubs should respond to current needs.
- Section 3 – Barriers: In this section, the most important barriers to participation in CS activities were captured, with particular emphasis on citizens’ concerns about potential drawbacks of and obstacles to Citizen Science.
- Section 4 – Drivers: In this section, the most important driving factors and enablers of CS activities were captured. The focus was on the factors that motivate citizens to participate in a CS initiative, as well as how they would like a CS project to unfold.
- Section 5 – Willingness to join: In this section, the preferred scientific topics and stages of CS activities were captured, with the aim to understand what fields attract most people and in which phases they would like to be involved.
- Section 6 – General information: This section includes basic demographic information such as sex, age, country, educational background, occupational status and others.
The large-scale survey tried to capture the current state-of-the-art in the four different countries of pilot RPFOs (Greece, Lithuania, the Netherlands, and Spain), by collecting ~2.000 questionnaires in total. Table 7 indicates the final numbers of collected questionnaires.
Table 7. Number of observations by country
| Country | Observations | Percentage |
| Greece | 322 | 16.63% |
| Lithuania | 342 | 17.67% |
| Netherlands | 675 | 34.86% |
| Spain | 597 | 30.84% |
| Observations | 1936 | 100.00% |
In order to better understand the survey results, an initial descriptive analysis of the sample for each country is needed. This provides all the necessary information regarding the type of stakeholders that have participated in our survey, alongside their demographic characteristics (age, sex, education level and occupational status). In this regard, Tables 8 and 9 present the overall sample structure (per absolute value[1] and percentage, respectively), highlighting that it is gender balanced in all countries. In terms of age structure, the Greek sample is characterised by an increased share of persons between 20-29 years old (40.68%) compared to other regions, followed by a very low share of under 20 years old (8.07%) and 60+ years old group of participants (5.28%). On the other hand, the opposite trend is observed in the Netherlands, where people from 60+ years old group form the majority (37.33%), with the shares of participants from other age groups decreasing in the same manner as the age intervals decrease. In Spain, the vast majority of respondents fall under the age groups 20-29 and 30-39 years old (64.16%), while participation from under 20 years old and 60+ years old group is marginal. Finally, in Lithuania, there is a more even distribution regarding participation from the different age groups, with people belonging to 40-49 years old age group being the majority.
When taking a closer look at the educational structure of the national samples, the distribution between the four pilots shows strong deviations. Although in all cases no education covers less than 5% of the samples, secondary education in the case of the Netherlands covers almost half of the collected sample (42,88%). At the same time, tertiary education shares, including both bachelor’s degree and master’s degree levels of tertiary education, are higher for the cases of Greece (57.63%), Lithuania (76.97%), and Spain (58.49%). It is also noticeable that in Greece, almost 1 out of 4 participants hold a PhD or equivalent (24.22%).
Stakeholder distribution is of equal importance to understand better the national samples. For the case of Lithuania, the distribution of stakeholders is interestingly even, with almost all categories having a share of roughly 20%, except from participants from the general public and civil society (43.28%). On the other hand, both in the cases of the Netherlands and Spain, the majority of respondents come from the general public/civil society (60.00% and 43.05%, respectively). However, the two countries differ regarding the distribution among the other stakeholder groups. In Spain, academic stakeholders come second (25.80%), while in the Netherlands the second highest stakeholder group is industry (21.04%). Finally, in Greece stakeholders from academia form the majority of participants, with a noticeable share of 63.04%.
The last demographic insight that we used for describing our samples refers to the occupational status of our survey participants. In this case, the majority in all cases – with the exception of Greece – refers to employed persons, which cover almost half or more than half of the national samples: 68.32% in Lithuania, 51.11% in the Netherlands, and 49.16% in Spain. Some particularities that differ between countries include the following: (i) high shares of students in Greece (42.50%); (ii) high levels of unemployed in Spain (17.62%); (iii) high share of retired persons in the Netherlands (24.44%); and finally (iv) very low shares of household activity for Greece, Lithuania, and Spain.
Table 8. Sample distribution by demographics and QH group
| Gender | Greece | Lithuania | Netherlands | Spain |
| Male | 45,03% (145) | 42,69% (146) | 50,96% (344) | 48,41% (289) |
| Female | 54,97% (177) | 57,31% (196) | 49,04%(331) | 51,59% (308) |
| Total | 100,00% (322) | 100,00% (342) | 100,00% (675) | 100,00% (597) |
| Age | Greece | Lithuania | Netherlands | Spain |
| Under 20 years | 8,07% (26) | 0,88% (3) | 1,93% (13) | 4,52% (27) |
| 20-29 years | 40,68% (131) | 16,67% (57) | 12,00% (81) | 36,52% (218) |
| 30-39 years | 17,08% (55) | 28,07% (96) | 13,19% (89) | 27,64% (165) |
| 40-49 years | 13,98% (45) | 30,12% (103) | 16,30% (110) | 20,44% (122) |
| 50-59 years | 14,91% (48) | 19,88% (68) | 19,26% (130) | 9,55% (57) |
| 60+ years | 5,28% (17) | 4,39% (15) | 37,33% (252) | 1,34% (8) |
| Total | 100,00% (322) | 100,00% (342) | 100,00% (675) | 100,00% (597) |
| Educational level | Greece | Lithuania | Netherlands | Spain |
| Less than a High School Diploma | 0,00% (0) | 0,00% (0) | 4,01% (27) | 5,04% (30) |
| High School Diploma | 18,07% (58) | 9,15% (29) | 42,88% (289) | 34,12% (203) |
| Bachelor’s Degree or equivalent | 30,84% (99) | 26,50% (84) | 27,30% (184) | 35,63% (212) |
| Master’s Degree or equivalent | 26,79% (86) | 50,47% (160) | 20,62% (139) | 22,86% (136) |
| PhD or equivalent | 24,30% (78) | 13,88% (44) | 5,19% (35) | 2,35% (14) |
| Total | 100,00% (322) | 100,00% (342) | 100,00% (675) | 100,00% (597) |
| Stakeholder group | Greece | Lithuania | Netherlands | Spain |
| Academia / Research | 63,04% (203) | 21,35% (73) | 12,59% (85) | 25,80% (154) |
| Public administration | 10,87% (35) | 19,30% (66) | 6,37% (43) | 8,21% (49) |
| Private sector/ Industry | 7,14% (23) | 16,08% (55) | 21,04% (142) | 22,95% (137) |
| Civil society / General public | 18,95% (61) | 43,28% (148) | 60,00% (405) | 43,05% (257) |
| Total | 100,00% (322) | 100,00% (342) | 100,00% (675) | 100,00% (597) |
| Occupational status | Greece | Lithuania | Netherlands | Spain |
| Employed | 41,88% (134) | 68,32% (220) | 51,11% (345) | 49,16% (293) |
| Unemployed | 2,81% (9) | 2,48% (8) | 2,67% (18) | 17,62% (105) |
| Self-employed/entrepreneur | 10,31% (33) | 15,84% (51) | 7,56% (51) | 10,40% (62) |
| Student | 42,50% (136) | 9,94% (32) | 3,85% (26) | 18,62% (111) |
| Household activity | 0,31% (1) | 0,93% (3) | 6,07% (41) | 1,01% (6) |
| Retired | 0,94% (3) | 1,55% (5) | 24,44% (165) | 1,34% (8) |
| Other | 1,25% (4) | 0,93% (3) | 4,30% (29) | 1,85% (11) |
| Total | 100,00% (322) | 100,00% (342) | 100,00% (675) | 100,00% (597) |
Table 9. Representativeness of sample in terms of gender
| Gender | Greece | Lithuania | Netherlands | Spain | ||||
| Sample | National population | Sample | National population | Sample | National population | Sample | National population | |
| Male | 45,03% | 48,66% | 42,69% | 46,68% | 50,96% | 49,68% | 48,41% | 49,01% |
| Female | 54,97% | 51,34% | 57,31% | 53,32% | 49,04% | 50,32% | 51,59% | 50,99% |
| Total | 100,00% | 100,00% | 100,00% | 100,00% | 100,00% | 100,00% | 100,00% | 100,00% |
Interestingly enough, results reveal that the lowest levels of familiarity are detected in the Netherlands (57.60%) and Lithuania (57.60%). Spain presents a more balanced distribution of scales of familiarity, even though people who declare that they are “somewhat familiar” form the majority (26.97%). Nevertheless, more than 1 out of 4 participants in Spain state that they are completely unfamiliar with the term. Greece shows some common patterns with Spain. On the one hand, the largest proportion of participants (30.12%) fall under the category “not at all familiar”. On the other hand, people who state that they are “somewhat familiar” form the second highest category, with 23.60%. At the same time, across all countries, Spain and Greece have the highest shares of people who say that they are extremely familiar with the term (7.54% and 8.07%, respectively).
Nevertheless, it must be stressed that the national variations on the awareness of CS can be partly explained by the age groups and educational level of participants. For instance, the higher levels of awareness in Spain and Greece are influenced by the fact that CS is a quite new concept and in those countries the percentage of 20-29 years old is higher with respect to Netherlands and Lithuania. Moreover, in Greece, half of participants hold either a Master’s degree or PhD, and there may be a positive correlation between educational level and level of CS awareness. At the same time, more than 4 out of 10 participants in the Netherlands hold only a high school diploma – a fact that may affect how knowledgeable are about Citizen Science. Background variables must be taken into account when unpacking the reasons of awareness levels.
Apart from examining the level of familiarity with Citizen Science, the degree of familiarity with the term “Responsible Research and Innovation” was investigated as well. As in the case of Citizen Science, a definition was provided to participants in the questionnaire: “Responsible Research and Innovation is an approach that anticipates and assesses potential implications and societal expectations with regard to research and innovation, with the aim to foster the design of inclusive and sustainable research and innovation”. This definition was chosen because it is the official definition by the European Commission (2021, 07/07, last accessed). Figure 7 presents the different levels of familiarity across all countries.
What is interesting to observe in the figure is the similarities with Figure 6. In other words, once again in the Netherlands and Lithuania, the majority of participants (43.11% and 45.32%, respectively), belong to the category “not at all familiar”. Reversely, Spain and Greece show the lowest levels from all countries regarding the category “not at all familiar” (14.41% and 19.25% respectively), while in the other side of the spectrum, they display high shares of participants who declare that they are “moderately familiar” with the term (25.29% and 23.29%, respectively). It is also worth-mentioning that in all countries, an interval of 20-25% of participants falls under the category “slightly familiar” with the term. Still, a general conclusion that can be drawn from both Figure 6 and Figure 7 is that the terms “Citizen Science” and “Responsible Research and Innovation” are not yet widely diffused in the general public.
Figure 6. Level of familiarity with the term “Citizen Science”
Figure 7. Level of familiarity with the term “Responsible Research and Innovation”
Table 10 deals with the previous experience, if any, with Citizen Science from participants from all pilot countries. In this case, all national countries show exactly the same trends: more than 8 out of 10 respondents have not any previous experience whatsoever with the Citizen Science activities. On the other hand, it should be mentioned that Greece and Lithuania present the highest shares of people who have some previous experience (18.32% and 18.42%, respectively).
Table 10. Previous experience with Citizen Science
| Previous experience | Greece | Lithuania | Netherlands | Spain |
| No | 81,68% | 81,58% | 85,63% | 86,10% |
| Yes | 18,32% | 18,42% | 14,37% | 13,90% |
| Total | 100,00% | 100,00% | 100,00% | 100,00% |
The participants who answered “Yes” in the survey questionnaire were re-directed to another question that captures the precise type of previous experience with Citizen Science (Figure 8). Strong differences can be observed between pilot countries. In Lithuania (63.39%) and Spain (38.27%), most people responded that their type of experience is “I have heard the term Citizen Science”. However, in the Netherlands, more than half of the sample (52.17%) stated that they initiative and/or designed themselves a citizen science project – this finding strongly contrasts the findings from the other countries. Finally, in Greece, almost half of participants (45.76%) selected the category “I have participated myself in a citizen science project”.
As general conclusion, it can be inferred that the maturity level of Citizen Science varies across countries, and even if two countries show commonalities, there are still differences with respect to the actual type of experience of the general public with CS activities. This necessitates different governance structures and possibly dissemination and engagement channels for the development of proper Citizen Science Hubs that respond to local social realities.
Figure 8. Type of previous experience with Citizen Science
Tables 11-14 present the results for the factors acting as significant benefits, drivers and barriers for citizen science projects related to the different types of stakeholders. To do so, the collected data from all pilot countries based on the type of stakeholder categorization were analysed and therefore, it was possible to get some specific insights about each type separately. Starting from the academics and the researchers that participated in the survey (Table 11), they have highlighted all identified benefits – apart from considering citizen science as a hobby – as significant for their perceptions and involvement in citizen science projects. In terms of drivers, their involvement seems to be motivated by continuous feedback, acknowledgements, inspiring coordination teams and clear guidelines and instructions. Barriers related to their perceptions include concerns whether they belong to a sociodemographic group that is underrepresented in the scientific community, lack of receiving the necessary guidelines and feedback, scepticism about cooperating with other stakeholder groups and fear that the project will not be properly organized and managed.
At this point, it must be stressed that all the identified factors that encourage or hinder participation with respect to CS activities, were statistically analysed and then selected as most important. This is valid for the hindering/enabling factors that were examined both for each stakeholder group and for the local ecosystems of the pilot RPFOs (Section 6.3.3). The factors that were found to be statistically significant (i.e., they have an important impact on the perception or involvement of participants) are marked with a tick sign in all respective tables. More detail on the statistical method that was used and on the initial results that emerged from the statistical analysis can be found on Annex C.
Table 11 Identified benefits, drivers and barriers related to perceptions and the involvement in citizen science projects for academics and researchers
| Benefits | Perception | Involvement |
| Benefits related to the individual (economic, social, educational). | + | |
| Benefits related to knowledge and skills. | + | + |
| Benefits derived when considering citizen science as a hobby. | ||
| Benefits related to new professional/career opportunities. | + | + |
| Benefits related to society and/or natural environment. | + | + |
| Drivers | Perception | Involvement |
| Continuous feedback and updates about the progress of the project | + | + |
| Acknowledgement of the contribution. | + | |
| The project is well-organized and managed | ||
| Inspiring coordination team | + | |
| Clear guidelines and instructions on the tasks | + | + |
| Barriers | Perception | Involvement |
| Lack of the necessary skills and knowledge to be involved in such activities. | ||
| Lack of the technological equipment that might be required. | ||
| Belong to a sociodemographic group that is underrepresented in the scientific community | + | |
| Lack of receiving the necessary guidelines and feedback. | + | |
| Low participation rate. | ||
| Fear that the contribution will be exploited by scientists/policy makers. | ||
| Fear of leading to wrong or harmful scientific or policy decisions. | + | |
| Lack of time to participate in such activities. | + | |
| Lack of financial incentives to participate. | ||
| Fear of not finding an interesting research topic. | + | |
| Scepticism about cooperating with other stakeholder groups. | + | + |
| Fear that the project will not be properly organized and managed. | + | + |
When taking a closer look at the responses received from policymakers, it is obvious that fewer factors can be captured referring to these aspects (Table 12). More specifically, benefits related to society and/or natural environment are the only significant factor in the first group, alongside with continuous feedback, inspiring coordinators and clear guidance that can work as significant drivers for policymakers and stakeholders coming from the public sector. Moreover, barriers related to their involvement in citizen science projects include lack of receiving the necessary guidelines and feedback.
Table 12. Identified benefits, drivers and barriers related to perceptions and the involvement in citizen science projects for policy-makers
| Benefits | Perception | Involvement |
| Benefits related to the individual (economic, social, educational). | ||
| Benefits related to knowledge and skills. | ||
| Benefits derived when considering citizen science as a hobby. | ||
| Benefits related to new professional/career opportunities. | ||
| Benefits related to society and/or natural environment. | + | + |
| Drivers | Perception | Involvement |
| Continuous feedback and updates about the progress of the project | + | + |
| Acknowledgement of the contribution. | ||
| The project is well-organized and managed | ||
| Inspiring coordination team | + | |
| Clear guidelines and instructions on the tasks | + | |
| Barriers | Perception | Involvement |
| Lack of the necessary skills and knowledge to be involved in such activities. | ||
| Lack of the technological equipment that might be required. | ||
| Belong to a sociodemographic group that is underrepresented in the scientific community | ||
| Lack of receiving the necessary guidelines and feedback. | + | |
| Low participation rate. | ||
| Fear that the contribution will be exploited by scientists/policy makers. | + | |
| Fear of leading to wrong or harmful scientific or policy decisions. | ||
| Lack of time to participate in such activities. | ||
| Lack of financial incentives to participate. | ||
| Fear of not finding an interesting research topic. | ||
| Scepticism about cooperating with other stakeholder groups. | + | + |
| Fear that the project will not be properly organized and managed. |
Table 13 presents the findings in relation to participants from the business and the private sector. Again, almost all factors included in the benefits’ list can significantly improve perceptions and involvement of this group in citizen science projects. Drivers in this case include – once more – continuous feedback and updates about the progress of the project, together with good organization and management. At the same time, barriers referring to perceptions highlight the importance of the lack of the technological equipment that might be required, receiving the necessary guidelines and feedback, the feeling of belonging to a sociodemographic group that is underrepresented in the scientific community, as well as concerns about the ability to effectively cooperate with other stakeholder groups. When it comes to actual involvement in citizen science project, the identified barriers include low participation rates and lack of time to participate in such activities from persons in the private sector.
Table 13. Identified benefits, drivers and barriers related to perceptions and the involvement in citizen science projects for business and private sector
| Benefits | Perception | Involvement |
| Benefits related to the individual (economic, social, educational). | + | + |
| Benefits related to knowledge and skills. | + | + |
| Benefits derived when considering citizen science as a hobby. | ||
| Benefits related to new professional/career opportunities. | + | |
| Benefits related to society and/or natural environment. | + | + |
| Drivers | Perception | Involvement |
| Continuous feedback and updates about the progress of the project | + | + |
| Acknowledgement of the contribution. | ||
| The project is well-organized and managed | + | |
| Inspiring coordination team | ||
| Clear guidelines and instructions on the tasks | ||
| Barriers | Perception | Involvement |
| Lack of the necessary skills and knowledge to be involved in such activities. | ||
| Lack of the technological equipment that might be required. | + | |
| Belong to a sociodemographic group that is underrepresented in the scientific community | + | |
| Lack of receiving the necessary guidelines and feedback. | + | |
| Low participation rate. | + | |
| Fear that the contribution will be exploited by scientists/policy makers. | ||
| Fear of leading to wrong or harmful scientific or policy decisions. | ||
| Lack of time to participate in such activities. | + | |
| Lack of financial incentives to participate. | ||
| Fear of not finding an interesting research topic. | ||
| Scepticism about cooperating with other stakeholder groups. | + | |
| Fear that the project will not be properly organized and managed. |
The final stakeholder group under investigation refers to citizens and the civil society. Table 14 shows that all identified benefits seem to motivate general public towards participating and having an increased perception of citizen science initiatives. In terms of drivers, even though being acknowledged for your contribution and provided with specific guidelines and instructions for the tasks can boost positive perceptions, only receiving continuous feedback and updates about the progress of the project seems to effectively improve participation in citizen science projects by general public. At the same time, it is interesting to notice that there are more barriers that affect both perceptions and involvement when compared to the other stakeholder groups. Common barriers between these two attitudes include: lack of the technological equipment, fear that the contribution will be exploited by scientists/policy makers, fear of leading to wrong or harmful scientific or policy decisions and scepticism about cooperating with other stakeholder groups. Barriers that are solely related to overall perception about citizen science refer to the lack of the necessary skills and knowledge to be involved in such activities, the feeling of belong to a sociodemographic group that is underrepresented in the scientific community, the lack of receiving the necessary guidelines and feedback and fear that the project will not be properly organized and managed. Finally, additional barriers that significantly affect citizens’ involvement in these initiatives include low participation rates, lack of time and fear of not finding an interesting research topic.
Table 14. Identified benefits, drivers and barriers related to perceptions and the involvement in citizen science projects for civil society and general public
| Benefits | Perception | Involvement |
| Benefits related to the individual (economic, social, educational). | + | + |
| Benefits related to knowledge and skills. | + | + |
| Benefits derived when considering citizen science as a hobby. | + | |
| Benefits related to new professional/career opportunities. | + | |
| Benefits related to society and/or natural environment. | + | + |
| Drivers | Perception | Involvement |
| Continuous feedback and updates about the progress of the project | + | + |
| Acknowledgement of the contribution. | + | |
| The project is well-organized and managed | ||
| Inspiring coordination team | ||
| Clear guidelines and instructions on the tasks | + | |
| Barriers | Perception | Involvement |
| Lack of the necessary skills and knowledge to be involved in such activities. | + | |
| Lack of the technological equipment that might be required. | + | + |
| Belong to a sociodemographic group that is underrepresented in the scientific community | + | |
| Lack of receiving the necessary guidelines and feedback. | + | |
| Low participation rate. | + | |
| Fear that the contribution will be exploited by scientists/policy makers. | + | + |
| Fear of leading to wrong or harmful scientific or policy decisions. | + | + |
| Lack of time to participate in such activities. | + | |
| Lack of financial incentives to participate. | ||
| Fear of not finding an interesting research topic. | + | |
| Scepticism about cooperating with other stakeholder groups. | + | + |
| Fear that the project will not be properly organized and managed. | + |
The next section presents a more thorough descriptive analysis on the trends and patterns in each of the four pilot countries, with the aim to provide a more detailed picture of attitudes, perceptions and propensities at national level.
[1] For some demographic variables, response was optional. That explains the differences in the total sum of answers.
-
- Page administrators:
- Gabija Velykytė
- Dovilė Lisauskienė
- Karolina Kardokaitė
- Ugnė Daraškevičiūtė
